
How AI Can Boost Predictive Maintenance In Manufacturing
How can Artificial Intelligence be used for predictive maintenance in manufacturing? New software technologies are helping business operations.
 Tom Jenkins
One of the nice features of the later versions of Microsoft Dynamics® NAV is the ability to send any page in NAV to Microsoft Excel, not only as a list of data as you would get with a copy and paste, but a refreshable link using the refresh button on the Dynamics NAV tab in Excel. This demos really well, and prospective customers love it, however there are draw backs, the resulting table in Excel does not allow you to add columns to do your own calculations or to do lookups to other data in the workbook. You can do PivotTables / Charts on the data, and refer to it in other areas of the workbook, but what if you want to manipulate the table as a whole? Luckily there is a solution that allows you to add columns and still retain the refresh capabilities of the workbook.

Let me start off with my golden rule of data sent to excel from Dynamics NAV.
“Never modify the NAV Datasheet.” By NAV datasheet, I mean the sheet that NAV creates when you press the Sent to Microsoft Excel button.
Why is this? Partly because you are restricted from what you can do, but mostly because it saves complications if you let NAV / Excel do their thing!
So if we can’t play with the data on the NAV datasheet, what can we do? One option is to create a query based on the NAV data region. Let’s look at this in a little more detail by creating a simple customer aging summary report in Excel based on open customer ledger entries.
The first step is to send the open customer ledger entries to NAV. Go to the customer list, select a customer and drill down on the balance in the Customer Statistics factbox, this gives you the open ledger entries for the selected customer. Expand the filter pane on the customer ledger entry page and delete the Customer No. filter, this will give you all open Customer Ledger Entries.
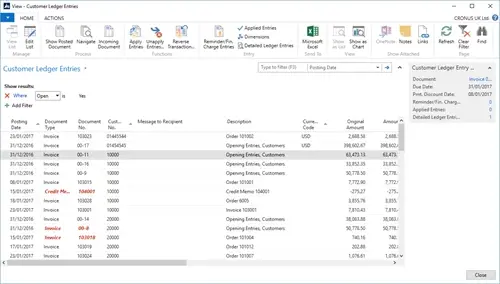
Press the Send to Microsoft Excel button to send the entries to NAV.
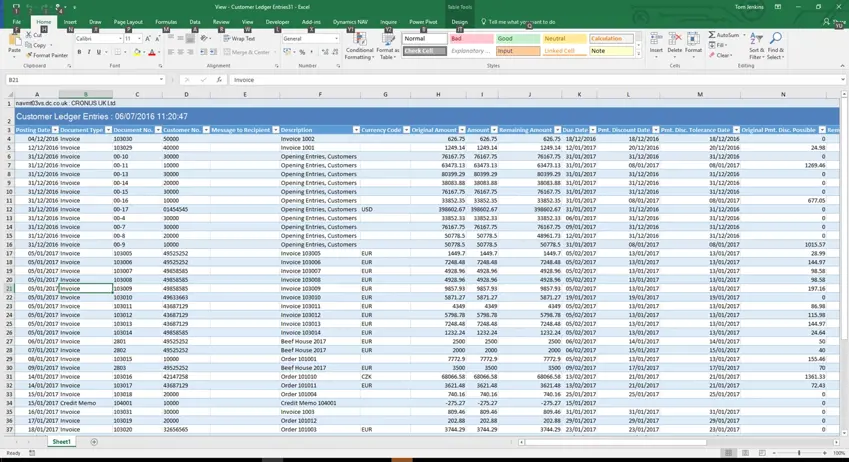
To use the NAV data in a query, click on the down arrow on the name box in the top left hand corner and select NavDataRegion, this will highlight the NAV data, then select the Data tab and in the Get & Transform section select From Table.
Selecting the NAV data.
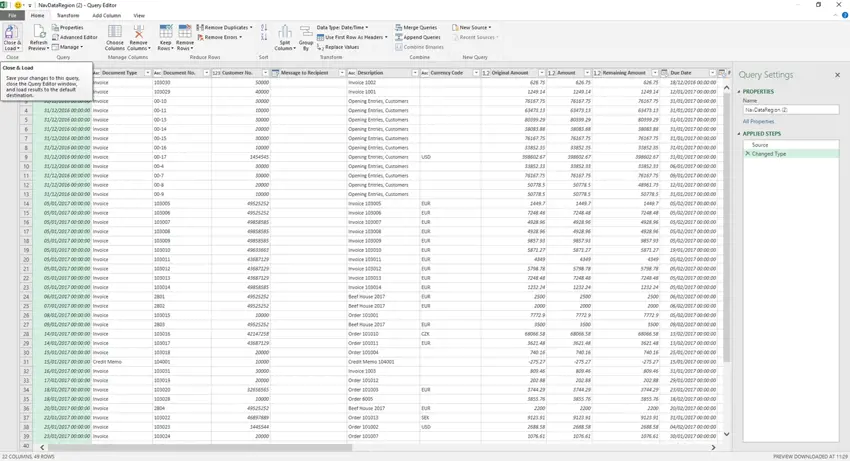
You will be presented with the Query Editor where you can choose columns, add columns and transform data as required.
We will just select the Close & Load option to load the data into a new worksheet.
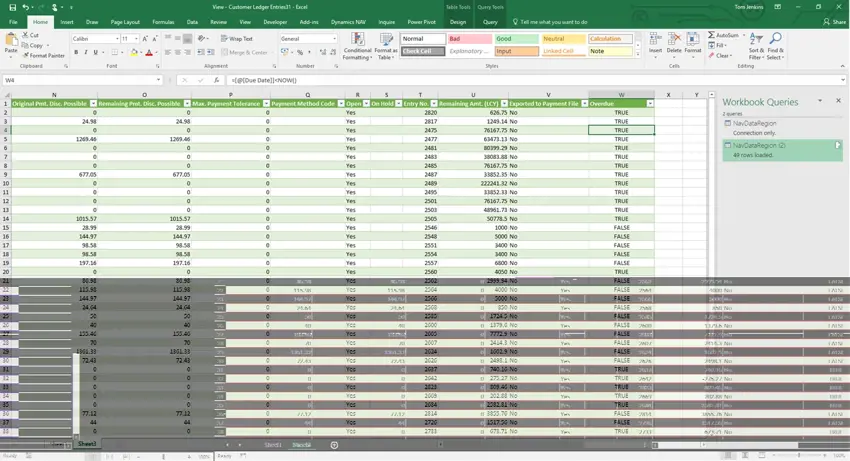
We still need to be careful manipulating the data in this new table. We cannot add a column to the middle of this table (if you wish to do this, then do it in the query editor window) as they will disappear when you refresh, but we can add columns to the end that are ‘refresh proof’.
Right click on the column heading in row one of the last column in the table and select Insert / Table Columns to the right. This will add an extra column to the end of the table. For this example, we will simply use this column to determine whether a given entry is overdue by renaming the column to Overdue and entering =[@[Due Date]]<NOW() in the first data cell in the column.
One further tweak required is to mark the Due Date column as a date format.
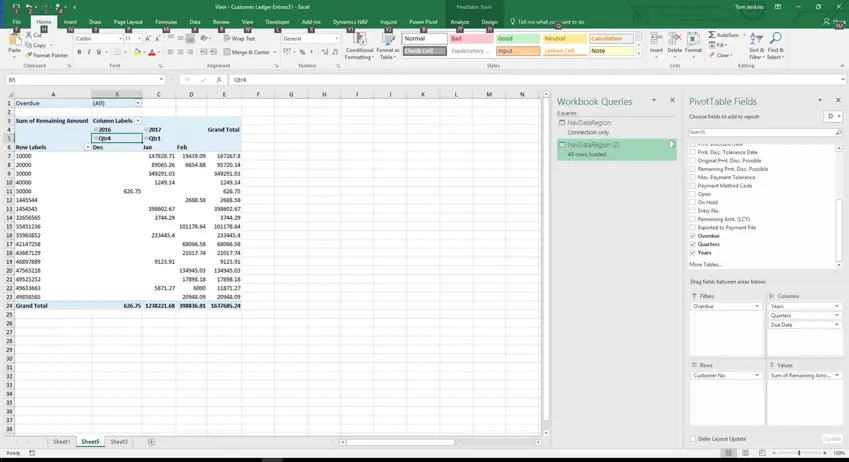
Now that we have our data table, based on our data sent from NAV, we can finish off the report by creating a PivotTable. Select anywhere on the data table above, and on the Insert tab select PivotTable. Excel should select the whole table, select the option to place the PivotTable on a New Worksheet and press OK. In the PivotTable fields, drag Customer No. to Rows, Due Date to Columns, Remaining Amount to Values and Over Due to Filters.
In next to no time, we have created a simple but effective Customer Aging Summary report, which can be saved and reused.
To update the report, we simply need to select the NAV Datasheet and press refresh on the Dynamics NAV tab, and then select the Data tab / Refresh All.
However, there are still limitations with this approach. For example, you can only link a workbook to one NAV page, so sophisticated reports across tables is not possible without resorting to other features such as data connections. For more sophisticated applications, Web Services and PowerPivot are the tools of choice, please take a look at our PowerPivot training course for more details.
One of our most popular training courses is the Power Pivot with Dynamics NAV course.

How can Artificial Intelligence be used for predictive maintenance in manufacturing? New software technologies are helping business operations.

Summarising technology changes for manufacturing companies in 2023 and what that means for 2024 such as artificial intelligence and industry 4.0

Manufacturing, Warehousing and distribution company Colorlites implements Business Central ERP with Dynamics Consultants in a phased approach